
NEXUS AI / SPATIAL STUDIO
Every layer, every connected system, one map in the browser.
Spatial Studio is the platform's map. It brings the network model and every other geographic layer together in a browser, lets people work on what they find there, and answers questions asked in plain language — without anyone needing a specialist tool on their desk.
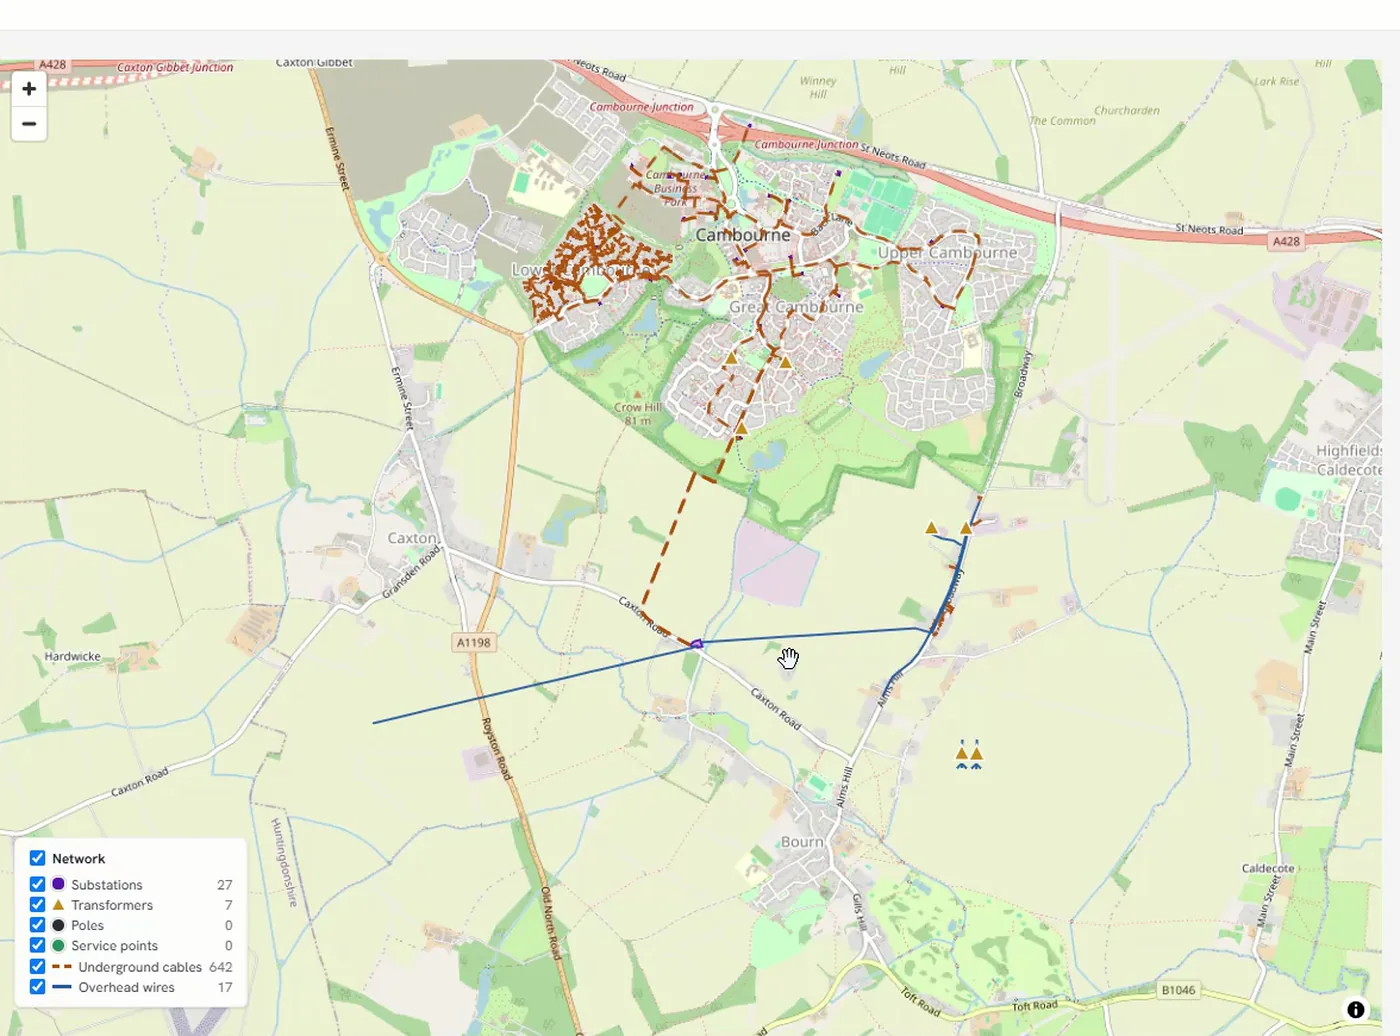
The same map carries the network at every scale. Zoom out and you are looking at how a village is fed; zoom in and you are looking at the individual service points along one road. Nobody installs anything to do it, and the layer panel stays under the reader’s control the whole way down.
Utilities accumulate map-based systems one problem at a time, and each new theme arrives with its own viewer. The electrical network sits in the GIS, vegetation somewhere else, telecom and joint use somewhere else again — and the questions worth asking cut across all three. The people who understand a problem are usually not the people holding the specialist seats.
-
Put the layers on one map
Electrical network, vegetation, telecom, joint use and external layers, seen together rather than one viewer at a time.
-
Read the network live
The network model comes from the GIS as it stands, through Gateway — not from a copy somebody refreshed last month.
-
Work on it, in the browser
This is a working environment rather than a viewer. People edit what they are looking at, bring data in, and take it away again in the formats their own work needs.
-
Ask in plain language
A natural-language assistant sits over the same data, so a question can be asked in ordinary words and answered across the network model and the connected systems, without writing a query.
-
Rules follow the user
Layer visibility is profile-based and enforced in query responses as well as on the map. A layer someone cannot see is not in their map and not in their answers either.
Trees near spans that keep failing
The vegetation layer read against the network, so the correlation is visible rather than inferred from two reports.
Where telecom and joint use overlap the grid
Fibre routes, pole occupants and the electrical network on one map, so overlapping risk is seen rather than reconstructed.
Someone outside the GIS team needs an answer
It runs in a browser, so the reach is the whole business rather than the seats that happen to have specialist software installed.
Each connection is made by API or by a direct database connection, and is defined once rather than per project.
- The network model and connected operational systems, through Gateway
- Direction: Read
- The specialist pods' own layers
- Direction: Read
- Grid Planner
- Direction: Editing, export and import of generated designs
- External geographic layers
- Direction: Read
| System | Direction |
|---|---|
| The network model and connected operational systems, through Gateway | Read |
| The specialist pods' own layers | Read |
| Grid Planner | Editing, export and import of generated designs |
| External geographic layers | Read |
Where it stops
- Your GIS remains the system of record and the specialist environment. Spatial Studio adds reach and breadth — every layer rather than one, in a browser rather than an installed seat — and does not replace it.
- A layer a profile cannot see is not in that person's map and not in their answers either.
- The specialist pods keep their own deliberately simplified single-layer maps. This is where those layers are seen together.
Who can see what
People sign in with the corporate directory account they already have, and what they are allowed to see is enforced in four places: at the platform, inside each pod, on the map, and in the answers that come back to them.
Where it stands
Technical walkthrough · 8 min
See it in action — watch the 8-minute Nexus AI Platform walkthrough.
Recorded directly in the platform, with English narration and no slide deck. GIS, ERP, ADMS, and maintenance answering together, without replacing the systems you already run. The link arrives after you register.
Need to brief your leadership? The one-page brief
A technical session covers your estate, where the platform would run, and which pods come first.
Book a technical session